
Ship
Monitoring
Monitoring watches your projects' apps and sites on every environment and server. It calls a private, key-protected health endpoint in your app on its own schedule, shows which services work and which fail with their errors, and hands a failure to AI to diagnose and fix. Build with AI gives Claude Code a prompt to build that endpoint. The Errors tab shows what Sentry recorded for each project, with the stack trace, ready to copy or hand to an agent.
Read about this part of Runova on the Ship page.
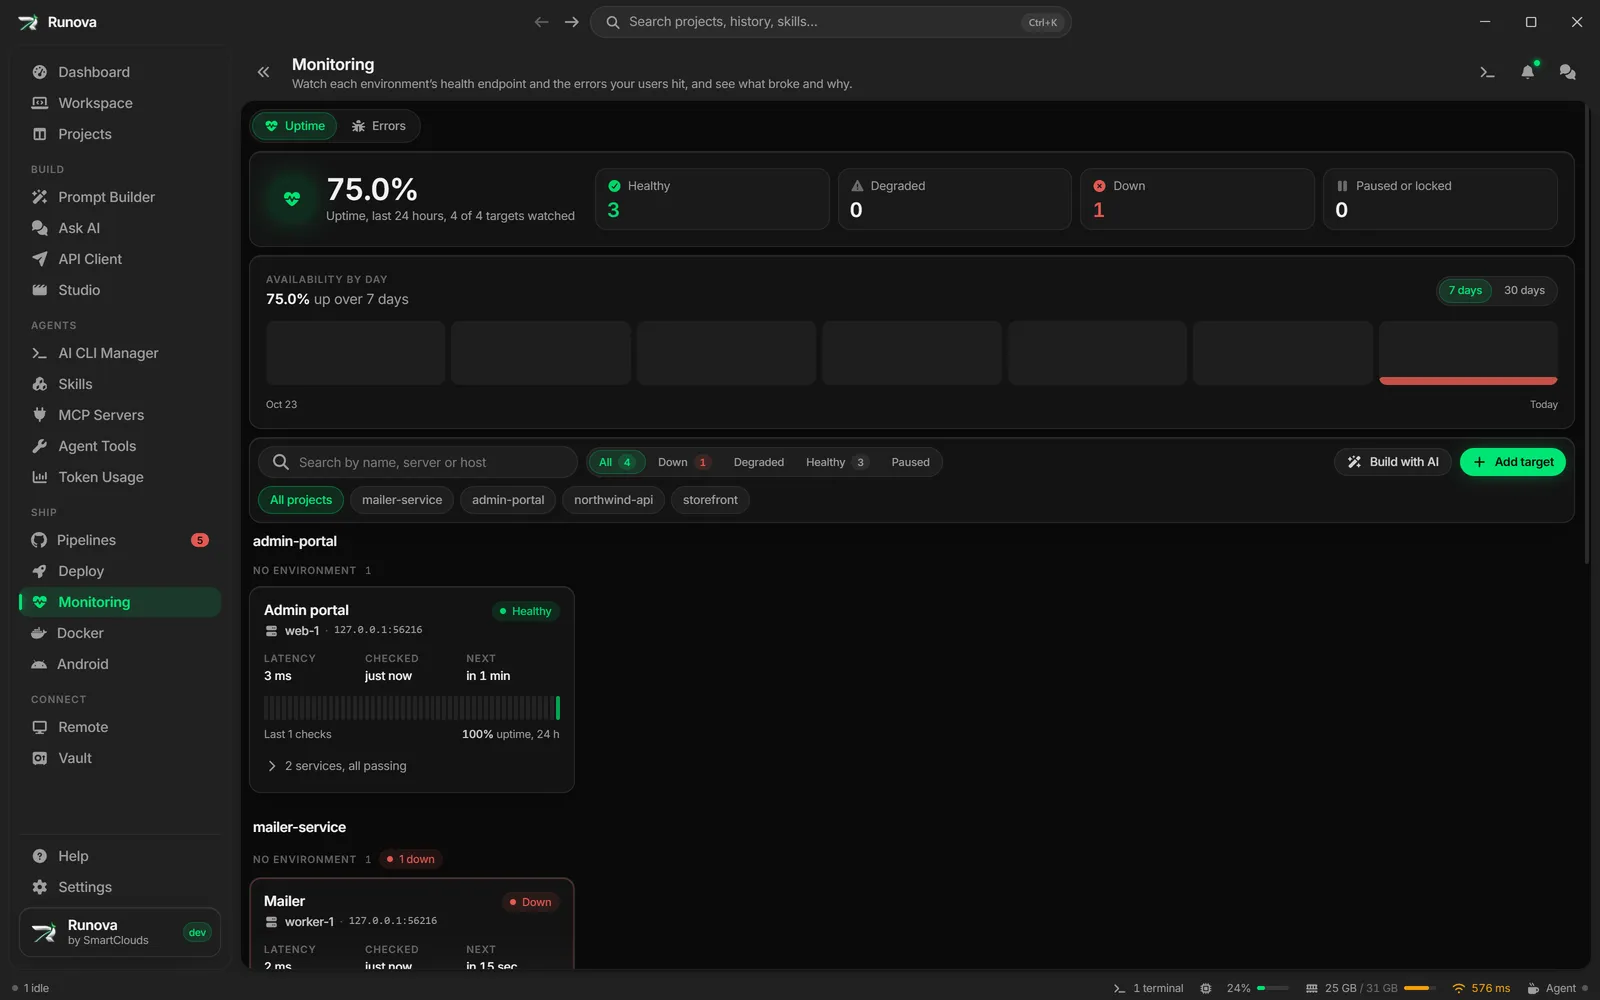
Monitoring tells you whether the apps and sites behind your projects are working right now. Each project can have any number of targets, one for each environment and server it runs on (for example Production on web-1 and web-2, and Staging on one server). Runova calls each target’s health check endpoint on the schedule you choose and shows every service the app reports (database, cache, queues, mail, external APIs and so on), whether it works, and the error of any that does not.
Where to find it
Click Monitoring in the menu, in the Ship group. The menu badge counts the targets that are down right now. Each project also has a Monitoring tab that shows only its own targets.
Monitoring has two tabs. Uptime is everything below about health checks. Errors shows the errors your users hit, as Sentry recorded them, described under Errors further down.
How it works
Your app answers the checks itself, through one small endpoint that follows the Runova Health Protocol. The protocol builds on the standard application/health+json format, so the report lists each check with a status of pass, warn or fail, and a failing check carries its error message, error code, details, stack trace and a hint about what usually fixes it.
The endpoint is private. It only answers a request that carries the target’s key (a Bearer key) or its username and password (HTTP Basic). Anyone else gets an empty 401, without even a hint of which checks exist. Your server never stores the key itself: it stores the key’s SHA-256 hash and compares hashes in constant time, so a leaked config file does not leak the key.
Build the endpoint with AI
Your app needs the endpoint before Runova can watch it, and your AI agent can write it for you. Click Build with AI (in the toolbar, on the first-use screen, or in a target’s details while it does not answer yet).
- Pick the project, and if you like the environment and the server. Choose Bearer key or HTTP Basic and the path (
/_runova/healthby default). Runova only picks the project for you when you open the dialog from a project’s own Monitoring tab, when a project is chosen in the page’s project filter, or when you have a single project. Otherwise the prompt area shows Which project is the endpoint for? with your projects listed, and you click one. The footer always says which project the agent will open in (“Opens in (project)”), or “Pick a project first”. - The prompt on the right updates as you go. It carries the whole Runova Health Protocol: the request, the report format, the security rules and an example. It asks the agent to read the project, check every service it really uses (database, cache, queues, storage, mail, external APIs), report the app’s version (read from where the project already keeps it, such as
package.json), and add tests. - Click Send to Claude Code (the button names your project’s agent) to start it in the project’s workspace with the prompt, or Copy prompt to use it anywhere else. The Protocol tab has the protocol on its own, for a developer or another AI.
The prompt never contains a key. It only names the server variables, and the key is made when you add the target.
Add a target
- Click Add target (or Add target at the bottom of Build with AI). Choose the project, the environment (from the project’s Environments tab), name the server, and enter the endpoint’s URL, such as
https://api.example.com/_runova/health. - Choose how often to check it, from every 30 seconds to once a day, or enter your own interval (at least 15 seconds). Each target has its own interval and you can change it at any time.
- Choose Bearer key (recommended) or HTTP Basic. Runova generates the key or password and shows it once, together with its SHA-256 hash and the name of the variable your server reads the hash from. Copy them now, because the key is never shown again. Runova keeps it encrypted in your Vault.
- If the endpoint is not built yet, click Build the endpoint with AI right after the key. That prompt is made for this target (its address and sign-in), and it has Test connection.
- Set the hash variable on your server, deploy, and click Check now or Test connection.
Add a check from a deployed app
On Deploy, open a server’s Apps section, open an app, and click Add health check in its toolbar. Monitoring opens with the add dialog already filled in: the app’s name, its project and environment (when the project is on this computer), the server, and the app’s address with /_runova/health on the end. The address is the app’s domain from Websites (https when the site has a certificate), or the server’s address and the app’s published port when no domain leads to it. Change anything you like and click Add target.
The new target stays linked to the app. The app’s page then shows Health check with the target’s state, and clicking it opens the target here. To drop the link, click Unlink in the target’s edit dialog. The target keeps working without it.
Reading a target
Each card shows the target’s state in words and with a colored dot, the app’s version when the endpoint reports one (such as v1.4.2), how long the last check took, when it ran and when the next one is due, and a strip of the last 50 checks (point at a bar to see when it ran and what it found). To hide the version, turn Show app version off in the target’s settings. Click a card to open its details: the version and release, every service with its result, the full error of a failing one, the incident history, and the raw report.
Above the cards, Availability by day shows one bar per day for the last 7 or 30 days, for the targets in view (it follows the project and environment filters). A full green bar is a day with no failed checks; amber and red bars had some. Point at a bar for that day’s uptime, how many checks ran and failed, and which targets failed. Click a day that had failures to list those targets and open one.
In a target’s details, Response time, 24 h draws the median and the slowest 5% (95th percentile) for each hour, with incidents shaded red, so you can see whether the app got slower before it went down.
Runova keeps a summary of every hour for 30 days, so the 24 hour uptime and both charts cover the whole period, however often the target is checked.
The states are:
- Healthy: every check passed.
- Degraded: the app works but reports a warning, such as a slow dependency or low disk space.
- Down: the app reports a failing check.
- Unreachable: no answer came back before the timeout, or the connection failed.
- Key rejected: the endpoint refused the key or password. Check that the hash on the server matches the target.
- Bad response: something answered, but not with a health report (an HTML page, a redirect, or a missing endpoint).
- Waiting: the first check has not run yet.
- Paused: you paused the target.
- Locked: your Vault is locked, so the key cannot be read. Checks resume as soon as you unlock it.
A single failed check does not count as an outage. Runova checks again within about 15 seconds and opens an incident only when the problem repeats, and it closes the incident the same way. You get a desktop notification and an inbox entry when an incident opens and when it resolves.
Fix it with AI
When an incident opens, Runova runs a read-only analysis with your project’s AI CLI in the background: it reads the error and the project’s code and writes down the likely cause, where it is, and what it would change. It never edits anything. The analysis appears in the target’s details. You can run it again with Run diagnosis, or turn Diagnose with AI off in a target’s settings.
To fix the problem, click Fix with AI. It opens the fix prompt (the failing services, their errors and the analysis) so you can edit it, then starts an agent tab for the project with it. Copy for AI puts the same prompt on the clipboard for any other tool.
Security
- Keys and passwords are encrypted in the Vault and never leave the main part of the app, except the one time they are shown after you create or rotate them.
- Runova refuses to send a key over plain HTTP, except to your own machine (localhost). You can allow HTTP for a target on a private network, but the dialog warns you first.
- It never follows a redirect, so a key is never sent to another address.
- Reports are capped in size and scrubbed of anything that looks like a secret (passwords in connection strings, tokens, keys) before they are stored, shown or put into a prompt. The endpoint should not send secrets in the first place, and the protocol tells your AI so.
- Rotate key makes a new key and the old one stops working at once. Update the hash on the server afterwards.
Errors
The Errors tab shows the issues Sentry recorded for your projects: what broke, where, how often, for how many users, and when it last happened. It works with Sentry.io (US and EU), a self-hosted Sentry, and GlitchTip as a best effort.
Connect Sentry
- In Sentry, create a personal auth token (User Settings, then Personal Tokens). Give it the scopes
org:read,project:readandevent:read. Addevent:writetoo if you want to resolve and ignore issues from Runova. Sentry cannot add a scope to a token later, so pick them now. The first-use screen has a Copy scopes button and a link to the token page. - Click Connect Sentry (or Connections in the toolbar). Choose where your Sentry is: Sentry.io (US), Sentry.io (EU), or Self-hosted or GlitchTip with its server URL. Paste the token and click Check token.
- Runova shows which scopes the token has and which organizations it sees. An organization token (the kind made for uploading releases) cannot read issues, and the dialog says so. Pick the organization and click Save connection.
The token is encrypted on this computer, together with your saved servers, and it is never shown again. If your saved servers are locked with a passkey, the Errors tab says so and offers Unlock.
Link your projects
Each Runova project is linked to one or more Sentry projects (a web app and its API, say). Under Link projects, pick them for each project. A project with no links yet starts with the Sentry projects whose names look like it already picked, so check them and click Save links. On a project’s own Monitoring tab, a project that is not linked yet shows the same picker just for itself.
Read the issues
The list shows the unresolved issues of the last 14 days, newest first. Each row has a colored stripe for the level (fatal, error, warning, info), the title, the file or function it came from, the short id, a New chip when it first happened inside the period, a small chart of events over time, the event and user counts, and when it was last seen. On the Monitoring page the issues are grouped by project, and the project chips narrow the list to one.
The toolbar searches the issues (the text goes to Sentry’s own search), filters by status (Unresolved, Resolved, Ignored, All), period (24 hours, 7 or 14 days) and environment, and sorts by last seen, most events, most users or newest. The list reads Sentry again every minute while it is open, and Refresh reads it right away. Load more gets the next page.
Click an issue to open it. You see its numbers and the latest event: the stack trace with your own code first and the line that failed highlighted (library frames are folded away behind Show N library frames, and a chained error shows what caused it), the breadcrumbs that led up to it, the request, and the tags.
Fix, copy, resolve
- Fix with AI opens a fix prompt built from the latest event (the error, your code’s frames, the last breadcrumbs, the request and the tags) so you can edit it, then starts an agent tab for the project with it.
- Copy for AI puts the same prompt on the clipboard for any other tool.
- Resolve and Ignore (for an hour, for a day, or for good) change the issue in Sentry. A toast offers Undo. Both need the
event:writescope; without it they are turned off and say why. - Open in Sentry opens the issue’s page in your browser.
What leaves Sentry is cleaned first: request headers, cookies and bodies are dropped, query values are masked, the user is kept as an id only, and emails, IP addresses and anything that looks like a secret are removed from messages and breadcrumbs, before anything is shown, stored or put into a prompt.