
Workspace
Browser and tests
Open your dev server in a built-in browser, leave comments on page elements for your agent, and run and fix tests from the Tests panel.
Read about this part of Runova on the Tests page.
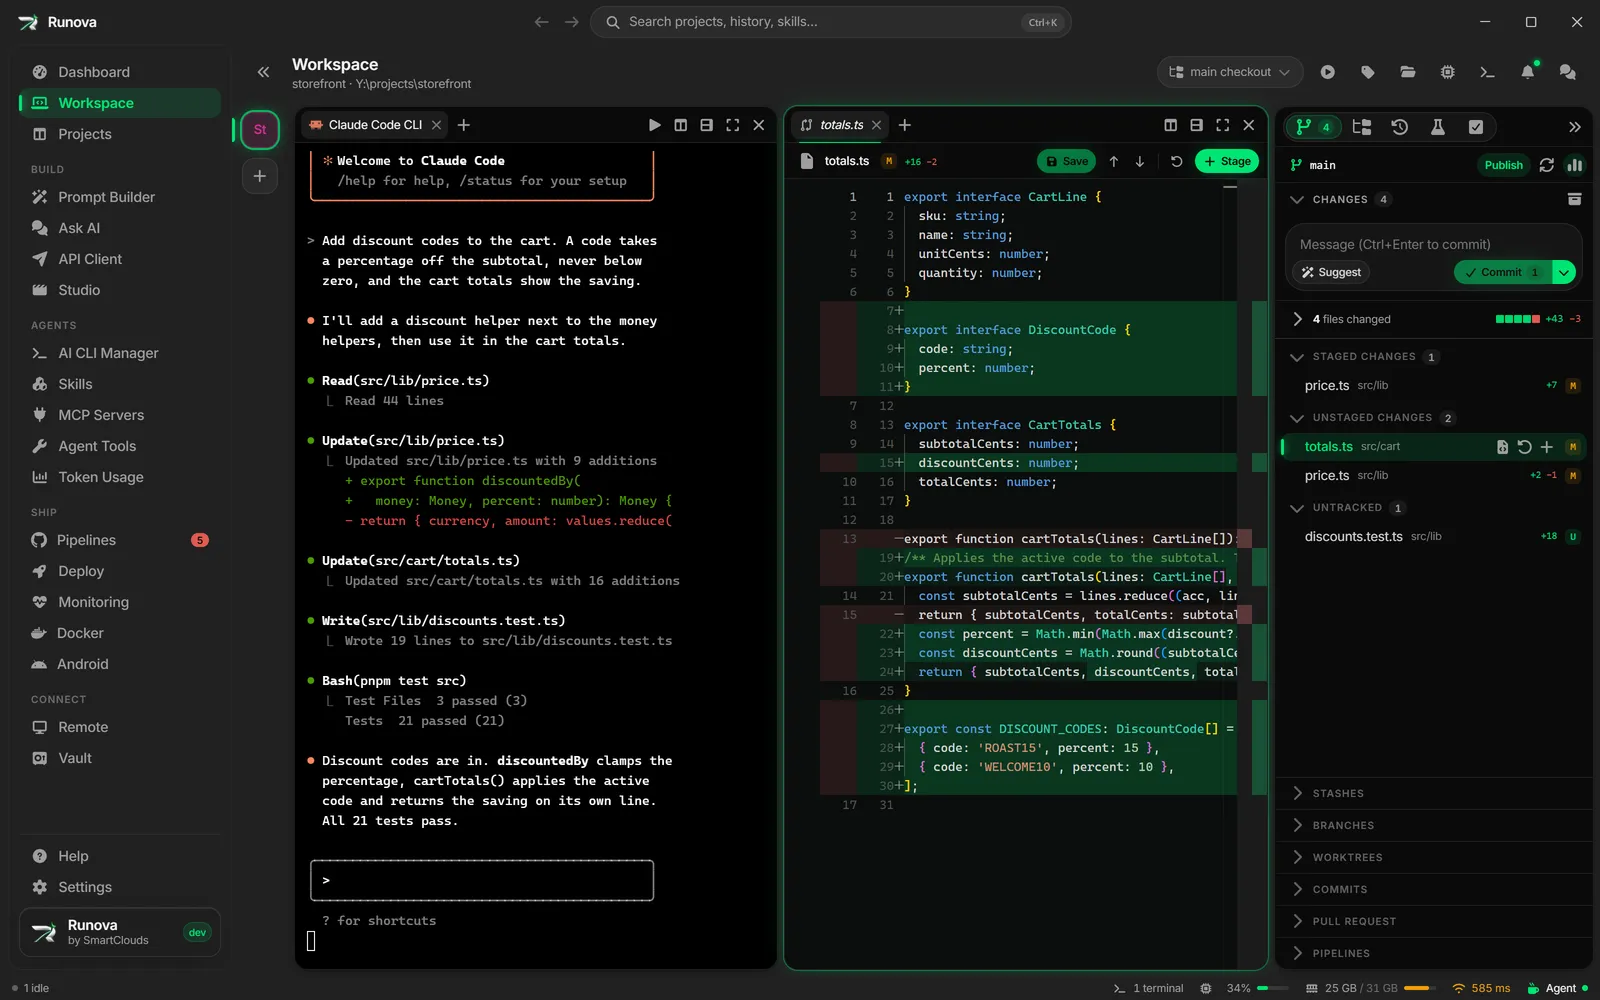
Two tools in the Workspace help you check what an agent built. The built-in browser opens your dev server (or any site) in a tab next to your terminals, and lets you point at things on the page and send comments to your agent. The Tests panel finds your project’s tests, runs them, shows what failed, and can hand failures to an agent to fix.
Where to find it
- Browser: click + in a pane (New tab) and choose Browser, click Browser on an empty pane, or press
Ctrl+Shift+B(Cmd+Shift+Bon macOS). - Tests: open the Tests tab (the flask icon) in the project panel on the right of the Workspace. A red number on its icon is how many tests failed in the last run, plus any test projects that could not run.
The browser tab
A browser tab shows a web page inside a pane. You can have several, in any pane, and split a pane to keep the page beside the terminal that runs the server.
The start page
A new browser tab opens on Open a page, with:
- An address box with the placeholder localhost:3000, a site, or a search.
- Running in this workspace: dev servers that terminals of this workspace have printed an address for, such as
Local: http://localhost:5173/. Click one to open it. Runova watches terminal output for these addresses, including from before you opened the browser, and remembers up to six per terminal. - Recent: the last few addresses you opened in this project.
- When no server has been seen, a hint says to start your dev server in a terminal of this workspace and its address shows up here.
A server started with the header’s Run button runs in the terminal drawer, not in a pane, so its address is not listed. Start it in a terminal tab of the workspace if you want it offered, or just type the address.
The address bar
Type or paste an address and press Enter. Ctrl+L (Cmd+L) jumps to the address bar.
- A local address such as
localhost:3000, a127.0.0.1address or a private network address opens overhttp. - Another host that contains a dot opens over
https. - Anything else, or anything with spaces, becomes a web search.
0.0.0.0(what many dev servers print) is opened aslocalhost.- Only
httpandhttpspages (andabout:blank) can be opened.
A padlock shows for https pages, and a Not secure label for plain http pages that are not on your own machine.
Toolbar
| Button | What it does |
|---|---|
| Back, Forward | Move through the page’s history. Alt+Left and Alt+Right work too (on macOS Cmd+[ and Cmd+]). |
| Reload / Stop loading | Reload the page, or stop it while it loads. F5 and Ctrl+R reload. |
| Pick an element to copy its details | Crosshair. See below. |
| Comment on an element for your agent | Speech bubble with a +, Ctrl+Shift+C. See below. A number on it counts the comments waiting. |
| Device size | Switch the page’s size, see below. |
| More | Open DevTools (F12), Reload without cache (Ctrl+Shift+R), Open in system browser, Copy address. |
These keys work while the page has focus as well. In the page, Ctrl+Shift+I also opens DevTools on Windows and Linux (Cmd+Option+I on macOS).
Right-click a browser tab in the tab strip for Reload, Copy address, Open in system browser and Close. The tab’s name is the page’s title, or its host while the page loads.
Device size
Device size lets you preview the page at phone, tablet or desktop size. The page is laid out at that size and scaled to fit the pane.
| Choice | Size |
|---|---|
| Responsive | Fills the pane. |
| Mobile | 390 by 844 |
| Tablet | 820 by 1180 |
| Desktop | 1440 by 900 |
The choice is remembered for the tab.
When a page does not load
A page that fails shows a message instead of the browser’s own error page. If nothing is listening on a local port, it says Nothing is listening on port {n} and asks whether the dev server is running. Start it in a terminal, then click Try again. If other servers are running in this workspace, they are listed under Running in this workspace so you can switch to the right one. Other failures show the error text.
Privacy and limits
The browser is separate from the rest of the app. Pages cannot use the camera, microphone, location or notifications, and cannot reach Runova’s own features. Copy buttons on pages and video fullscreen work. Sites see a normal Chrome browser. Cookies and sign-ins are kept between sessions, so you stay logged in to your own dev app. Links that open a new window open as a new browser tab.
Open tabs and their last address come back when you reopen Runova.
Comment on page elements for your agent
This is the fastest way to say “change this button” without describing where it is.
- Click Comment on an element for your agent, or press
Ctrl+Shift+C. A hint at the top says Click an element to comment · Right-click to copy · Esc to stop. - Click an element on the page. A card opens next to it with a small screenshot of the element and its selector.
- Choose the kind of comment: Change (ask for a change), Fix (something is broken), or Ask (a question, answered without touching the code). The placeholder changes to fit.
- Type your comment, then click Add (or press
Ctrl+Enter) to keep it and pick another element, or Send (Ctrl+Shift+Enter) to add it and send everything now.
Each comment becomes a numbered pin on the page, and a tray at the bottom right lists them. The tray has:
- Hover a row to make its pin pulse on the page. Click a row to jump to its element (or to its page, when it was left on another one).
- Edit and Delete buttons on each row.
- Copy comments, Clear comments (it asks when you have more than two) and Hide comments (it folds into a small counter you can click to bring it back).
- Send to {agent}, and an arrow (Choose where to send) to pick a running agent tab in this workspace or New {CLI} tab to start a new one.
Sending types all the comments into the agent’s input box as one prompt, without pressing Enter. For every element the prompt names the component, selector, text and, when it can, the source location, and it points to the element’s screenshot file so the agent can look at it. Values of URL parameters that look like secrets are replaced before anything is sent. The comments clear once the agent has them. If the agent could not take the text, it goes to your clipboard and the comments stay. See Terminals and agents for how the agent is chosen.
Copy an element’s details
Pick an element to copy its details (the crosshair) works the same way, but a click copies the element’s details to the clipboard so you can paste them into any chat, and the picker stays on for the next element. Right-click does the same while commenting. Press Esc to stop.
Dev servers
Runova does not start your dev server for you inside the browser. You start it in a terminal, the way you normally would, and the browser picks it up.
- Open a terminal tab in the workspace (a shell or an agent) and start your server, for example
pnpm dev. - When the server prints its address, open a new browser tab. The address is listed under Running in this workspace.
- Click it. If the server restarts on another port, a failed page lists the new address.
Use the header’s Run button when you want a command from the project’s settings run in the terminal drawer instead. See Workspace.
The Tests panel
The Tests tab finds the tests in the project, runs them, and shows each result. It knows Vitest, Jest, Playwright, Mocha, pytest, unittest, Go, Cargo, .NET, Dart, Flutter, PHPUnit, RSpec, Gradle and Maven projects. If it finds none, it says No tests found and lists these. Click Look again after adding some.
Two buttons sit in the panel’s header row, under the title Tests:
- Run all tests, which turns into Stop tests while a run is going.
- Refresh tests, which looks for tests again.
The test list
Tests are shown as a tree: a test project for each framework found (a folder with its own tests), then files, suites and tests. Click a folder or file row to fold it. Projects with more than 300 tests start with their files folded.
- Each row has an icon for its state: running, failed, passed, skipped, or not run yet. Durations show next to tests that ran.
- Hover a row for Open {name} (opens the file in the editor) and Run {name} (runs just that project, file, suite or test). Double-click a row to open its file.
- Click a failed test to open or close its failure details: the error message, Show stack and Hide stack, and buttons Fix with AI, Copy issue and Open file.
- Filter tests narrows the list by name. All, Failed, Passed and Skipped limit it by result, each with its count.
- If a project has more test files than the panel reads, a warning says some are not listed.
Results and re-running
While tests run, a line says Running {n} tests… and the counts update live, for example 2 failed, 40 passed, 1 skipped, with a timer. A stopped run says Stopped.
A long suite is not cut off just because it takes a while. Runova only stops a test project when it has printed nothing at all for 30 minutes, and every line of output starts the wait again. A project stopped that way shows a card saying the run “printed nothing for 30 minutes and was stopped”, with its log. When the run ends:
- Run failed runs only what failed, and runs again every test project that could not run.
- Fix all with AI appears when more than one thing failed, counting projects that could not run (except ones whose test tool was not found).
- Output shows or hides the raw output of the run in a pane at the bottom.
The last run comes back when you return to the project, and the failing count stays on the tab’s icon even when you are looking at another tab.
When tests cannot run
If a test project fails to start (a missing dependency, a broken config), a card says {project} could not run with the reason and the command’s log. Copy output copies it. Fix with AI is offered unless the problem is that the test tool was not found.
A project that could not run counts as one failure. It is added to the failed count in the summary, to the Failed filter and to the red number on the tab’s icon, and its card shows under All and Failed.
Fix tests with AI
Fix with AI (on one failure, on a run problem, or Fix all with AI) opens the same dialog as every other Fix with AI button. The prompt already holds the failure, the test file, and the command to run it again. You can edit it, pick a model and effort, and launch an agent in a new tab, where the prompt waits for Enter. See Terminals and agents.
Copy issue puts a ready-made bug report on the clipboard: the test name, the framework, the error, and the command that reproduces it.
Tips
- Keep the browser in a split pane next to the agent that is editing the page, and use Comment on an element instead of describing what to change.
- Switch Device size to Mobile before you comment on a layout bug.
- Run Run failed after each agent fix, so you only wait for what matters.
- A red number on the Tests icon is a quick reminder that something is still failing, even when you are in another panel tab.