
Agents
Token Usage
Track tokens, cost and plan limits across your AI coding agents and API providers, get alerts before you hit a limit, and pin live usage widgets to your desktop or Dashboard.
Read about this part of Runova on the Token usage and auto-continue page.
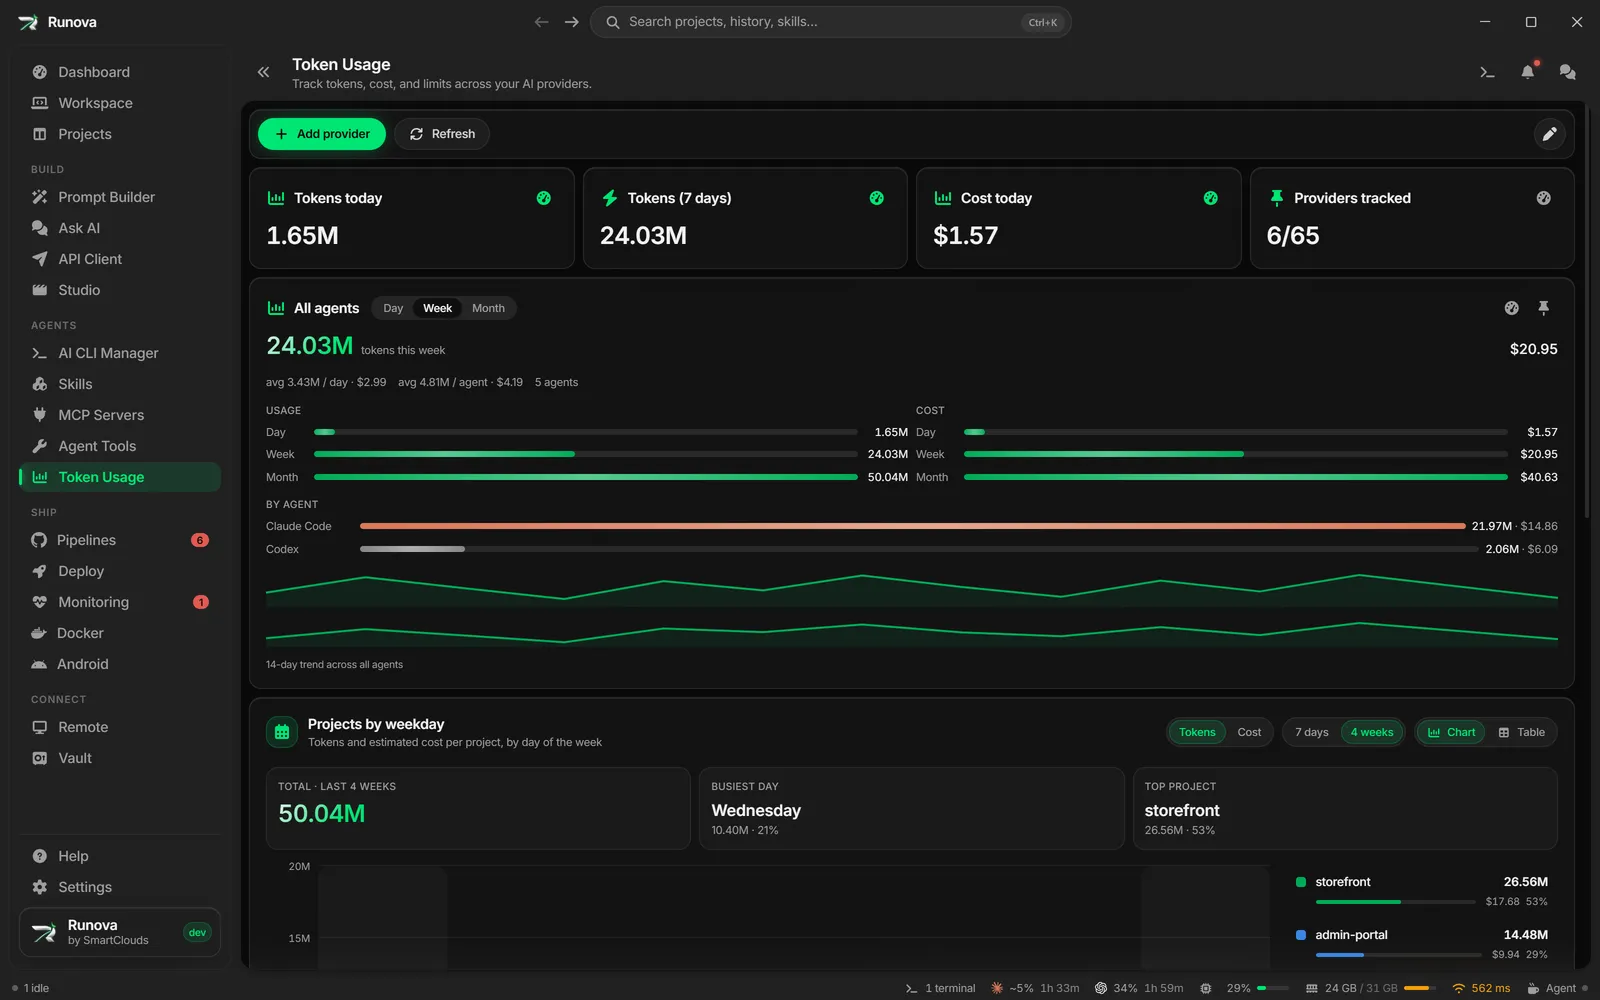
Token Usage shows how many tokens your AI tools have used and what that is worth in dollars, plus how close you are to your plan’s limits. Claude Code, Codex, Cursor, GitHub Copilot, OpenCode and Gemini CLI connect on their own. API providers such as OpenAI, OpenRouter or DeepSeek connect when you paste a key. You can set alerts for when a limit is nearly used up or has just reset, and pin any card as a frosted-glass widget on your desktop or on the Dashboard.
Where to find it
Click Token Usage in the sidebar under Agents, or open the command palette and type “Token Usage”. The status bar at the bottom of the window also shows your current limit (see below), and clicking it opens this page.
How the numbers are collected
There are three kinds of source, and the Add a provider dialog labels each one.
| Source | Providers | How it works |
|---|---|---|
| Local logs · automatic | Claude Code, Codex, GitHub Copilot, OpenCode, Gemini CLI | Runova reads the session data these CLIs already keep on your machine (Claude Code under ~/.claude/projects, Codex under ~/.codex/sessions, Copilot under ~/.copilot/session-state, OpenCode in its opencode.db session database, Gemini CLI under ~/.gemini/tmp). No key, no network, and every run counts, whether you started it from Runova or another terminal. |
| Signed-in app · automatic | Cursor | Cursor keeps no local token log, so Runova reads your usage through the Cursor desktop app’s signed-in session. Sign in to the Cursor app and the card connects itself. |
| API key | OpenAI, OpenRouter, z.ai, LiteLLM, DeepSeek, Moonshot | You paste a key and Runova asks the provider for spend or balance. These providers usually report credit and cost, not raw token counts, so their cards show cost and a limit bar and may show zero tokens. |
Another 53 providers are listed as Soon (an integration is registered but not wired yet). The dialog title counts 65 providers in total.
Note: Usage is cached for about 30 seconds, and the page re-reads it every 45 seconds. Click Refresh to force a fresh scan.
Tip: For OpenAI, use an Admin key, since the organization costs endpoint needs one. LiteLLM reads from
http://localhost:4000by default.
The page
Summary tiles
Four tiles sit at the top: Tokens today, Tokens (7 days), Cost today and Providers tracked (for example 6/65). They add up every tracked provider that loaded successfully. Each tile has a small dashboard icon that adds the tile to your Dashboard (and removes it again, after a confirmation).
All agents
The All agents card combines every tracked provider. It has Day, Week and Month chips and shows the headline token count and cost for that period, averages per day and per agent, a Usage and Cost comparison of the three periods, a By agent breakdown with a bar for each provider, and a 14-day trend chart. Icons on the card add it to the Dashboard or pin it to the desktop. If nothing is tracked yet, it says “Track a provider to see combined usage, averages, and cost across your agents.”
Projects by weekday
The Projects by weekday card sits under All agents. Each column is one day of the week and each coloured segment is one project, so you can see which folders the tokens and the cost went to on which days. It covers the last 4 weeks, or the last 7 days when you pick that. Hover a column for its figures, or move between columns with the arrow keys. Click a project in the legend to see it alone, and click it again to show every project. Switch to Table for every project against every weekday.
Projects come from the folder each Claude Code, Codex, OpenCode or Gemini CLI session ran in. A folder inside a registered project, or one of its git worktrees, counts for that project, and any other folder shows under its own name. The six busiest projects get a colour of their own, and the rest are grouped as Other. Days follow your time zone, and cost is an estimate at list prices. Cursor, Copilot and the API-key providers do not record a folder, so they are not part of this card. That is why its totals can differ from the All agents card.
OpenCode
OpenCode gets the same card as Codex: Day / Week / Month chips, the cost-led headline with a per-day average, side-by-side Usage and Cost bars for the three periods, and the 14-day trend sparkline. OpenCode keeps one total per conversation in its session database (no per-message times), so each conversation counts on the day it was last updated. Dollars are the cost OpenCode itself recorded, falling back to the list-price estimate when it recorded none.
Gemini CLI
Gemini CLI gets the same card as Codex, in Gemini blue: Day / Week / Month chips, the cost-led headline with a per-day average, side-by-side Usage and Cost bars for the three periods, and the 14-day trend sparkline. The CLI’s session files under ~/.gemini/tmp name the project folder but carry no token counts, so the card reads zero until the CLI persists token usage; the project split, cost attribution and trend light up from the same scan once it does. There is no plan-limits view: the CLI reports no rate-limit windows to draw.
GitHub Copilot
Copilot gets the same card as every other provider, with one extra: a By feature split into Chat, Code completions and CLI, each with tokens and cost. The headline leads with the cost in the provider’s accent colour and the tokens after it. The CLI’s own logs are read automatically and priced at list rates, so the card shows its Cost section like the Codex card. For IDE completions and chat, the card accepts an optional personal access token plus your organization (stored with the provider’s settings): it then reads your org’s Copilot metrics API (the token needs manage_billing:copilot, read:org or read:enterprise scope) and falls back to the local logs if that call fails.
Provider cards
Each tracked provider gets its own card with its logo and name. The card shows:
- Day / Week / Month chips and the headline tokens and cost for that period, with a per-day average.
- A limit bar when the provider reports one (for example Cursor’s plan quota, or a budget or balance for API providers), with a reset countdown when known.
- Side-by-side Usage and Cost bars for day, week and month.
- For Cursor, a breakdown of the period into named slices (for example Auto versus API-priced calls) with tokens, cost and request counts.
- For GitHub Copilot, the same kind of split into Chat, Code completions and CLI.
- For Gemini CLI, the same Codex-style card in Gemini blue; the CLI’s session files carry no token counts, so it reads zero until the CLI persists them.
- A 14-day trend sparkline.
A card can also show a connect message instead of numbers: “Sign in to the Cursor app to track usage”, or “API key required to track usage”. If a provider fails to load, the card shows the error in red and the other cards keep working.
The icons in a card’s header are:
| Icon | What it does |
|---|---|
| Bell | Opens Reset alerts (on the Claude Code card only). |
| Warning triangle | Opens Usage threshold alert (on the Claude Code card only). |
| Clock or chart | Switches the card between Show plan limits and Show tokens and cost (only when the account reports plan limits). |
| Dashboard | Add to dashboard or Remove from dashboard. |
| Pin | Add to desktop, which opens the widget dialog. |
| X | Remove the provider from tracking (API-key providers only, since Claude Code, Codex, Cursor, Copilot, OpenCode and Gemini CLI are always on). |
Plan limits view
For Claude Code on a subscription plan, the card can show your plan’s rolling limits instead of raw tokens. A plan badge (such as Pro, Max or Ultra) appears, then one bar per limit with the percent used and a “resets in” countdown:
- Session (5h): the 5-hour block, which starts with your first message after an idle gap.
- Weekly: the rolling 7-day limit.
- Weekly (Fable): a separate weekly bucket that only plans above Pro have.
The bars turn red at 90% and above. When Runova can read your account, the numbers come from the account itself. When it cannot reach it, it reconstructs the windows from your local logs, marks them with a ~ and the word estimated, and the tooltip says why. Under the bars you see tokens used today and the dollar-equivalent cost. If the account bills an API key and has no limits, the card stays on the tokens view.
Costs are estimates calculated from token counts with a built-in model price table, so they are “API-equivalent” figures. They are not an invoice.
Add a provider
- Click Add provider at the top.
- Search the list (the box says “Search 65 providers…”). Each row shows the provider, a category badge and its source.
- For an API-key provider, paste the key in the box and click Add. The row then shows Added. Claude Code, Codex, Cursor, GitHub Copilot, OpenCode and Gemini CLI show Auto and need nothing. Providers marked Soon cannot be added yet.
Keys are stored in Runova’s settings on your machine. Remove a provider with the X on its card. That stops tracking it and takes its card off the Dashboard.
Reorder cards
Click the pencil icon (Edit card order) at the top right to show a drag handle on each provider card. Drag cards into the order you want, then click the check mark (Done editing).
Refresh
Refresh clears the cache and rescans every provider.
Alerts
Both alerts watch Claude Code’s plan windows (Session, Weekly and Weekly (Fable)). A window your plan does not report shows “Your plan does not report this window” and cannot be used.
Usage threshold alert
Click the warning triangle on the Claude Code card to open Usage threshold alert.
- Turn on Notify at threshold.
- Set Threshold (%), from 1 to 100 (the default is 90).
- Choose which windows to watch with the switches (Session (5h) by default).
- Click Send a test alert to check that notifications work.
Runova checks about once a minute. When a watched window reaches the threshold you get an operating system notification, or an in-app alert if the system cannot show one. It fires once per window until that window resets or drops back below the threshold. Clicking the notification opens Token Usage and highlights the provider’s card with a ring.
Reset alert (Telegram)
Click the bell on the Claude Code card to open Reset alerts. When a watched window rolls over and your quota is full again, your Telegram bot sends you a message with the window, the plan, the reset time and the next reset.
- Set up your Telegram bot token and chat ID in Settings first. See Notifications and Telegram.
- Turn on Telegram reset alert. The switch tells you when the next message is due (“Next message in …”), or that it is idle.
- Choose the windows to watch.
- Optionally type a Chat/group ID to send these to a different chat. Leave it empty to reuse the chat from Settings. The bot token always comes from Settings.
- Click Send a test alert and check Telegram.
If you turn it on without a bot token and chat ID, Runova warns you: “Add your Telegram bot token and chat ID in Settings to receive these.”
Widgets
A widget is a small frosted-glass window showing one provider’s usage, floating on your desktop. They are separate from the main Runova window.
Pin a widget to the desktop
- Click the pin icon (Add to desktop) on a provider card, on the All agents card, or when the card is showing plan limits, to pin that view.
- In the Add to desktop dialog, check the live preview and adjust the settings (below).
- Click Add to desktop.
You can pin several widgets, even for the same provider (for example one for tokens and one for plan limits). New widgets appear slightly offset so they do not stack exactly.
Widget settings
The same settings appear in the pin dialog and in the widget itself.
| Setting | What it does |
|---|---|
| Period | Day, Week or Month for the headline numbers. |
| Background blur | How frosted the glass is, from 0 to 100%. |
| Background color | Theme, one of the presets (Ink, Slate, Navy, Forest, Wine, Sand, Frost) or a custom color. |
| Always on top | On: stays above other windows. Off: sits on the desktop behind other windows and shows when you show the desktop. |
| Size | S, M or L. You can also resize the widget by dragging its edges. |
| Style | Color uses the provider’s brand color. Mono uses a plain neutral tint. |
Use a widget
- Drag the thin strip along the top of a widget to move it. Position and size are remembered.
- Hover a widget to see its buttons. The clock or chart button switches between plan limits and tokens (when the account has limits). The gear opens widget settings, with Remove from desktop at the bottom. Click the gear again (Back to usage) to return.
- The period chips inside a widget change its period too.
- Widgets refresh about once a minute.
- On Windows and Linux, closing the main Runova window closes the widgets too, and they come back the next time you open the app.
See Widgets and the desktop pet for other desktop widgets.
On the Dashboard
Provider cards, the All agents card and the four summary tiles can be pinned to the Dashboard with the dashboard icon. A pinned provider card mirrors the view (tokens or plan limits) its Token Usage card is showing. In the Dashboard’s edit mode you can reorder or remove them, and an Open Token Usage button takes you back here. If you stop tracking a provider, its Dashboard card says it is no longer tracked.
The status bar
Claude Code, Codex and Cursor each get their own item in the status bar at the bottom, in that order, whenever the account reports plan limits. An item shows the provider’s logo, the percent used of its soonest-resetting limit and a countdown to that reset. Click it to open a panel with the plan name and every limit the provider reports, each with a meter, the percent and a reset countdown. Open Token Usage in that panel takes you to the provider’s card.
A Refresh button sits beside the provider’s name in that panel. It re-reads that one provider and leaves the others alone.
If a provider’s limits cannot be read, its item stays in the bar. It keeps the last limits it reported, dimmed with a warning icon, until those limits reset. The panel then says “Last read” with how long ago, and what went wrong. A provider that has never been read shows only the warning icon, and its panel says what went wrong.
The countdowns and the “Updated” time in the panel refresh every half minute, so they keep moving while you leave the window alone.
- Claude Code shows its 5-hour session and weekly limits. Runova asks Claude for them, and when Claude answers that it is being asked too often, waits as long as Claude says before it asks again, so a busy moment does not turn into a run of failures. A new sign-in is read straight away. When Claude cannot be reached and there is no earlier reading to show, the item falls back to an estimate worked out from your local session logs. It is marked with a
~before the percent, and the panel says “Estimated from local logs” with the reason. An estimate is never saved as if it were Claude’s own numbers, and the last real reading always wins over it. - Codex reads its limits from its own session logs: a ChatGPT plan has a 5-hour session and a weekly limit, while a free account has a single monthly one. The numbers are as of your last Codex turn, and the panel’s “Updated” time is when that turn happened. A limit whose reset time has passed shows 0% until your next turn, and if it was the account’s only limit, the Codex item leaves the bar until then.
- Cursor shows how much of the plan’s included usage is spent this billing cycle, in total and split into Auto and API, with a countdown to the end of the cycle. An older request-based plan shows its monthly request limit instead.
To hide a provider’s item, turn off its switch under Status bar limits on the General tab of Settings.
Tips
- Use Show plan limits on the Claude Code card to see how close you are to the 5-hour and weekly caps, and set a threshold alert at 80 or 90 percent so you are warned in time.
- The All agents card is a good one to pin to the desktop with a week period for a quick spend check.
- If a card looks stale, click Refresh. If a number looks wrong for Cursor, make sure you are signed in to the Cursor app.
- Token counts for API-key providers are often zero because the provider only reports spend or balance.
Related
- AI CLI Manager
- Dashboard
- Widgets and the desktop pet
- Notifications and Telegram
- Agent Tools
- AI providers
- Projects: the Usage section of a project’s page shows what that project’s conversations cost