
Getting started
Dashboard
The Dashboard shows live CPU, memory, disk, GPU and network charts, Docker and emulator usage with a list of the idle ones, GitHub activity, your installed AI CLIs and projects, and CLI update alerts, in a layout you can rearrange.
Read about this part of Runova on the Everything else page.
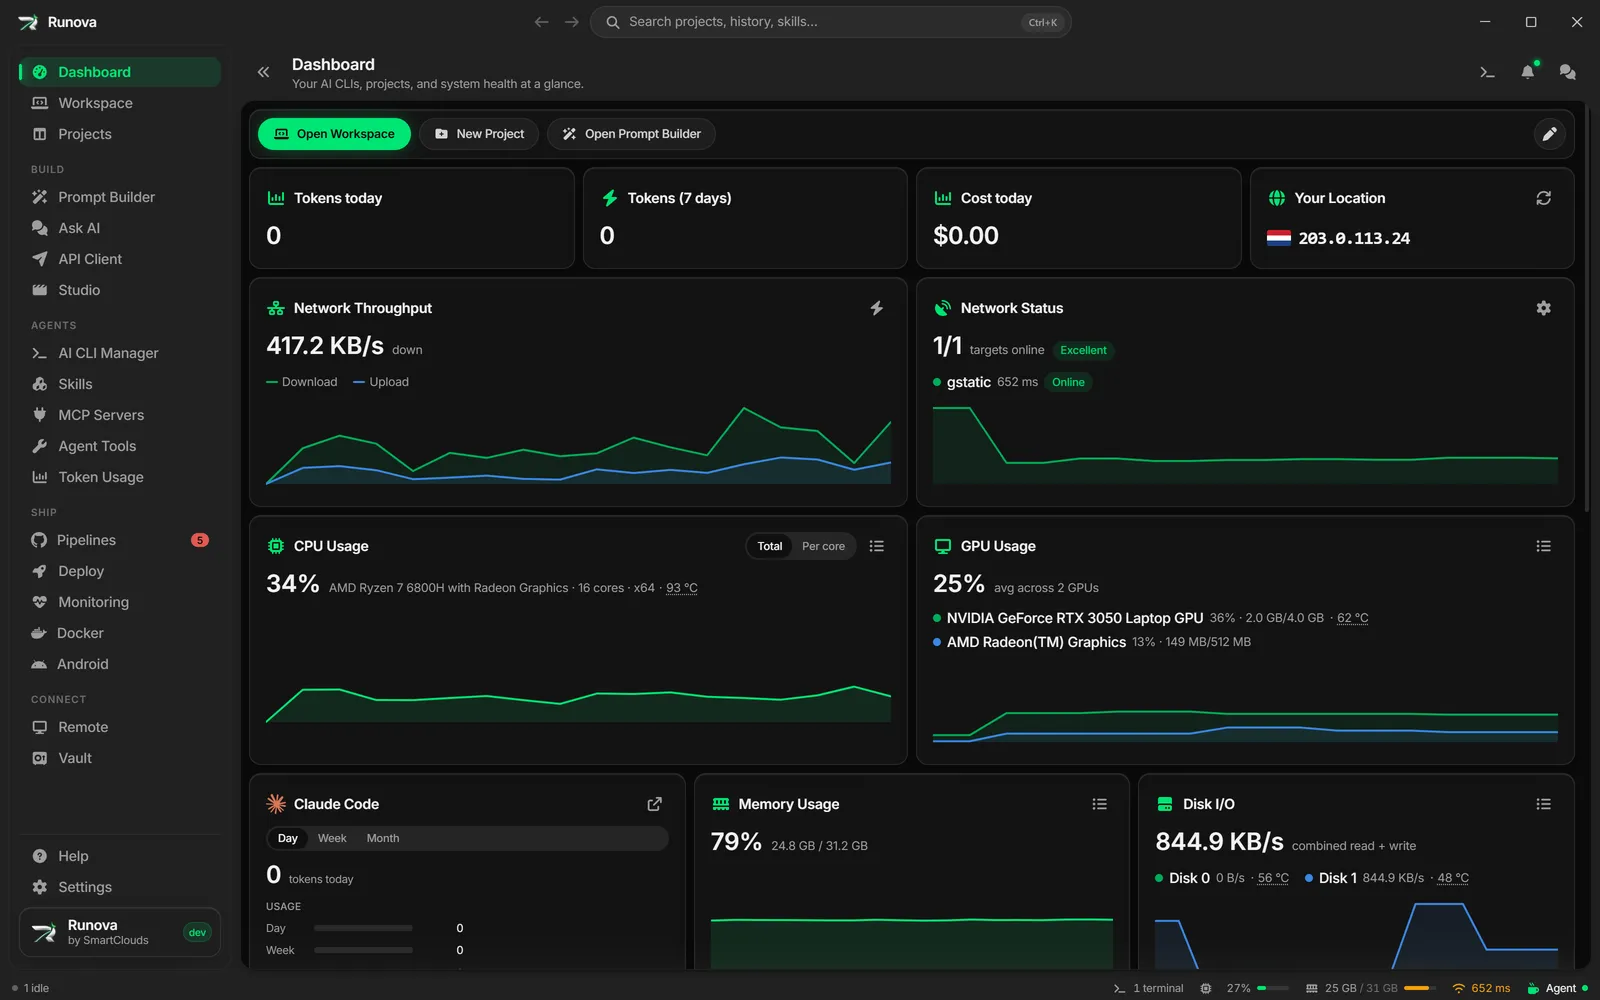
The Dashboard is the first page most people see. It shows how your machine is doing right now (CPU, memory, disk, GPU and network), the Docker containers and Android emulators that are running and which of them nobody is using, the state of your GitHub account and workflows, how many AI CLIs and projects you have, and a list of CLIs and tools that have updates waiting. Every card can be moved, hidden or brought back, so you can make it show only what you care about.
Where to find it
Click Dashboard in the menu (the first entry), or open the command palette and type Dashboard. It is also the page Runova opens on the first launch, and it is the page opened by the Startup page setting if you choose it. The page header reads “Dashboard”, with the line “Your AI CLIs, projects, and system health at a glance.”
Quick actions
Two buttons sit at the top left of the page:
- New Project opens the Projects page with the new project dialog already open. See Projects.
- Open Prompt Builder goes to the Prompt Builder. See Prompt Builder.
At the top right are the pencil button (Edit layout) and, while you are editing, Add card. See Customize the layout.
The cards
Out of the box the Dashboard shows ten charts and four stat tiles. Cards sit in rows, two to a row at first. On a narrow window, rows of three or four columns step down to two and then one so nothing gets squeezed.
System charts
The charts update live. They sample about every two seconds and keep roughly the last two minutes, and the history is kept while you visit other pages, so coming back does not start the chart from nothing. Hover a chart to see the value at that moment.
| Card | What it shows |
|---|---|
| CPU Usage | Total CPU use as a percentage, with the processor model, number of cores and architecture (such as x64 or ARM64). When the machine has more than one core, Total and Per core buttons switch the chart between one line and a line for each core. When the CPU temperature can be read, it appears at the end of that line. See Temperature. |
| Memory Usage | The percentage of RAM in use, with used and total memory, and the memory temperature where it can be read. |
| Disk I/O | Combined read and write speed, and a line for each disk, with each drive’s temperature where it can be read. It says “No disk activity detected.” when nothing is reported. |
| GPU Usage | GPU use as a percentage (the average when you have several GPUs), plus each GPU’s memory. It reads NVIDIA cards on any system, the integrated GPU on Windows, and every GPU on a Mac, Apple Silicon included. It shows N/A and “No supported GPU detected.” when none can be read, for example an AMD or Intel GPU on Linux. An NVIDIA GPU’s temperature is shown after its memory. |
| Network Throughput | Download speed as the headline number, with lines for download and upload. |
| Network Status | How many of your ping targets are online, a quality label, and each target’s latency. |
Each of CPU, Memory, Disk I/O and GPU has a Top apps button (a list icon) in the card’s header. It opens a dialog such as Top CPU apps, Top memory apps, Top disk apps or Top GPU apps, listing the apps using the most of that resource right now and refreshing every few seconds. Each row shows the app, how much it uses and its process ID. The button at the end of a row, End followed by the app name, ends that process after you confirm with End process. Be careful: unsaved work in that app can be lost. If your system cannot report per-app GPU or disk use, the dialog says so.
Temperature
Temperatures appear in °C next to the figures they belong to: at the end of the processor name on the CPU card, after used and total memory on the Memory card, after each drive’s speed on the Disk I/O card, and after each GPU’s memory on the GPU card. The charts show usage only. Point at a temperature (or move to it with Tab) and its history is drawn as a dashed line on the same chart, over the last two minutes. The line goes away when you move off. On the Disk I/O chart the line has its own scale in degrees, since the chart itself is in MB/s. There is no separate temperature card. Where each reading comes from depends on the system:
- CPU on Linux: the kernel’s own sensors, which covers Intel and AMD processors and ARM boards such as a Raspberry Pi. Some ARM servers report no CPU sensor at all, and then no temperature is shown.
- CPU on Windows: the system’s thermal zones, on x64, x86 and ARM64 PCs. These need no administrator rights, but on many desktops the zone is a sensor on the motherboard rather than in the CPU, and some PCs report none. The reading is refreshed about every ten seconds.
- CPU on macOS: macOS does not give apps the temperature without administrator rights, on Apple Silicon or Intel Macs. Instead the CPU card shows the thermal state macOS reports: Nominal, Fair, Serious or Critical. Serious and Critical mean the Mac is slowing itself down to cool off.
- Memory: only on Linux, and only for memory modules that have a sensor (DDR5, and some server and ECC DDR4). Most desktop and laptop memory has none, and Windows and macOS give apps no way to read it, so the Memory card usually shows no temperature.
- Drives: on Windows, each drive’s own sensor, asked through the storage driver without administrator rights (NVMe drives and most SATA SSDs). On Linux, NVMe drives always, and SATA drives when the
drivetempkernel module is loaded. macOS reports none. Drive temperatures are refreshed about once a minute. - GPU: only NVIDIA cards report a temperature (on any system). Other GPUs show usage without one.
When no reading is available the card simply leaves the temperature out.
Network Throughput and speed test
The Network Throughput card has a lightning bolt button, Test network speed. It opens a dialog called Network Speed Test. Click Open speed.cloudflare.com to run the test in your browser, which measures your connection more accurately than a test running inside the app.
Network Status and ping targets
The Network Status card shows a count such as “3/3 targets online” and a quality badge (Excellent, Good, Fair or Poor). Hover the badge to see the percentage of pings answered over the time the chart covers. Under it, each target is listed with its latency and an Online or Offline badge.
- Click a host name (an IP address or host, not a web address) to open Diagnose. The dialog has two buttons, Ping (ping -t) and Traceroute (tracert -d). Each opens a terminal with the command already typed. Press
Enterthere to start it. - Targets that are web addresses are shown by the site name, with the full address in a tooltip. They have no diagnose dialog.
- The gear button, Manage ping targets, opens Settings so you can change the targets. The ping settings are in the Network tab of Settings, in the Network ping targets card. If you land on a different tab, click Network.
Change the ping targets
- Open Settings and click the Network tab.
- In the Network ping targets card, pick a Method:
- Ping command uses the system ping. It fails where ICMP is blocked.
- URL request times an HTTPS request, which works behind most firewalls.
- Auto pings first and switches to URLs if nothing answers.
- Under Hosts to ping, type a host and press
Enterto add it. The default is1.1.1.1. - Under URLs to request, add web addresses. The default is
https://www.gstatic.com/generate_204. Reset to default brings it back. - With URL requests, set Request every to a number of seconds from 1 to 300. The default is 5.
- Click Save changes.
The same targets feed the network figure in the status bar, and the AI pet’s internet alerts. See Interface tour and Widgets and desktop pet.
GitHub Activity
The GitHub Activity card draws your GitHub contribution heatmap, with a number for the contributions this week (and your @username) and for the year, and a Less to More legend. It needs the GitHub CLI (gh) to be installed and signed in:
- If
ghis missing, the card says to install the GitHub CLI. The link opens its download page. - If it is not signed in, the card offers
gh auth login. Clicking it opens a terminal with the command typed. PressEnterthere to sign in. - Before it is connected the card reads Not connected.
The medal button opens GitHub notifications: the unread items from the GitHub account signed in on this computer, with a badge showing how many are unread. Click an item to open it on GitHub, the check button to mark one as read, Mark all as read for all of them, or Open on GitHub for the notifications page. The refresh button re-reads the activity and the notifications. Activity is refreshed every ten minutes and notifications every two.
GitHub Actions
The GitHub Actions card charts the workflow runs of your GitHub projects: how many passed this week, how many failed and how many are running, with a chart of passed and failed runs across the repositories of your projects. If no project has a GitHub remote, the card says to add one. The history button, Actions history, lists recent workflow runs across your projects, and its All runs and filters button goes to Pipelines. It uses the same gh sign-in as GitHub Activity.
Docker and Emulator Usage
The Docker and Emulator Usage card charts how much CPU or memory your running Docker containers and Android emulators use, with one line for Docker and one for emulators, over roughly the last two hours. The CPU and Memory buttons switch between the two. CPU is measured so that 100% means one full core, so a busy container can read above 100%. A line only appears for a kind that has actually been running, so if you never use emulators you only see Docker. Hover the chart to see the value at that moment.
The numbers come from Runova itself, which reads Docker and the Android emulators about every 30 seconds in the background. The chart keeps filling in while you are on other pages, and starts empty each time you open Runova. If Docker is not installed or not running the card says so, and Runova stops asking for a couple of minutes instead of failing every time.
Idle Docker and Emulators
The Idle Docker and Emulators card lists running containers and emulators that nothing has used for a while, so you can stop them and free the memory they hold. The large number is how many are idle, with the total running beside it, and the line under it says how long something has to sit unused before it is listed.
- A container counts as used while it spends CPU (2% of a core or more) or moves network or disk data, which is why a database that sits at 0% CPU but is still being queried is not called idle. An emulator counts as used while it spends about a quarter of a core of CPU or more. Anything else is idle, and its row says for how long.
- The stop button at the end of a row stops that container or emulator straight away. It is easy to start again, so there is no extra question.
- Stop all idle appears when two or more are idle. It lists what it will stop and asks first. Anything that became busy again while you were deciding is left running, and the message afterwards says so.
- The gear button, Idle settings, sets the number of minutes (1 to 1,440, and 20 by default) and whether to be notified. They are the same options as in Settings, General. The refresh button, Check again now, takes a new reading right away.
- With alerts on, Runova sends one system notification when something first goes idle, and again only after it has been busy and then idle again. Clicking it opens the Dashboard.
Note: The idle clock starts when Runova first sees something running. Restarting Runova starts it again, and so does waking the computer from sleep, so nothing is called idle for time nobody was watching. An emulator started outside Runova is found through its console port. If it cannot be matched to a running process the card says it cannot be measured, and never calls it idle.
News
The News card lists technology news from runovahq.com and marks the security fixes that affect the tools installed on this computer. It is described in its own article, News.
Stat tiles
| Tile | What it shows |
|---|---|
| Installed CLIs | How many AI CLIs are installed out of all the CLIs Runova knows about, shown as a fraction. See AI CLI Manager. |
| Active Projects | The number of projects that are not archived. See Projects. |
| Skill Repositories | How many skill repositories you have added. See Skills. |
| Your Location | A flag and your public IP address. Click the address to copy it (“IP address copied.”), and use the refresh button to look it up again. It says Unavailable if the lookup fails. |
Token Usage cards
Three kinds of Token Usage cards can be added to the Dashboard. By default none of them are shown.
- All agents: a combined usage chart. Its Open Token Usage button goes to Token Usage.
- Summary tiles: Tokens today, Tokens (7 days), Cost today and Providers tracked.
- A card for a single provider. You add these from the Token Usage page.
Add All agents and the summary tiles from the Add card menu while editing the layout.
Update AI CLIs & tools
Below the cards, the Update AI CLIs & tools card lists installed AI CLIs and agent tools that have a newer version, with a count badge such as “2 updates”. Each row shows the current version and the new one, with an Update button. Clicking it opens a terminal with the update command typed. Press Enter there to run it. The refresh button, Re-check for updates, checks again.
If nothing is installed the card links to the AI CLI Manager and Agent Tools. When everything is current it says all installed CLIs and tools are up to date, and it notes how many could not be checked automatically. Update checks wait until the page has finished loading, so they do not slow it down.
Customize the layout
You can reorder, resize and hide almost everything on the Dashboard. Your layout is saved automatically and kept between launches.
Turn on edit mode
- Click the pencil button, Edit layout, at the top right. It turns into a check mark button, Done editing.
- Rows get dashed outlines, cards get drag handles and remove buttons, and a short hint appears.
- Click Done editing when you finish.
Move cards and rows
- Drag a card by its handle (the grip icon in its header, tooltip Drag to move between rows) and drop it on another card to place it before that card, or onto the Drop a card here tile at the end of a row.
- Drag a row by the handle at its left (tooltip Drag to reorder rows) to change the order of rows. While you drag a row, a Drop here to move row to the end area appears at the bottom.
- Only the handles are draggable, so clicking buttons on a card never starts a drag.
Change how many cards a row holds
Each row has its own Columns buttons, 1, 2, 3 and 4. A row of four small tiles can sit above a row of two big charts.
Add and remove rows
- Click Add row at the bottom to add an empty row. Empty rows are only visible while editing.
- Click the trash button on a row (Remove row; its cards move to the row above) to delete it. Its cards move to the row above, or below for the first row, so none are lost. The last remaining row cannot be removed.
Hide and bring back cards
- Click the X on a card (Remove from dashboard) to hide it. A message confirms which card was removed.
- Click Add card to open the menu of everything you can show. It has three groups: Charts (CPU Usage, Memory Usage, Disk I/O, GPU Usage, Network Throughput, Network Status, GitHub Activity, GitHub Actions, Docker and Emulator Usage, Idle Docker and Emulators, News), Dashboard stats (Installed CLIs, Active Projects, Skill Repositories, Your Location) and Token Usage (All agents, Tokens today, Tokens (7 days), Cost today, Providers tracked). Cards that are showing are ticked. Click one to add or remove it. New cards go into the last row that has a free space.
A built-in chart added by a later version of Runova shows up on its own once. If you hide it, it stays hidden.
Tips
- Use Top apps on the CPU or Memory card when the machine feels slow, to see which program is responsible.
- If the Network Status card shows Offline targets but the internet works, switch the Method to URL request in Settings, Network. Some networks block ping.
- The status bar at the bottom shows live CPU, memory and network figures on every page, so you do not need to keep the Dashboard open.