
Deploy
Containers, apps and stacks
Manage Docker on a server you deploy to, with live container lists, logs, consoles, images, volumes and networks, and deploy compose apps from your projects with rollbacks.
Read about this part of Runova on the Ship page.
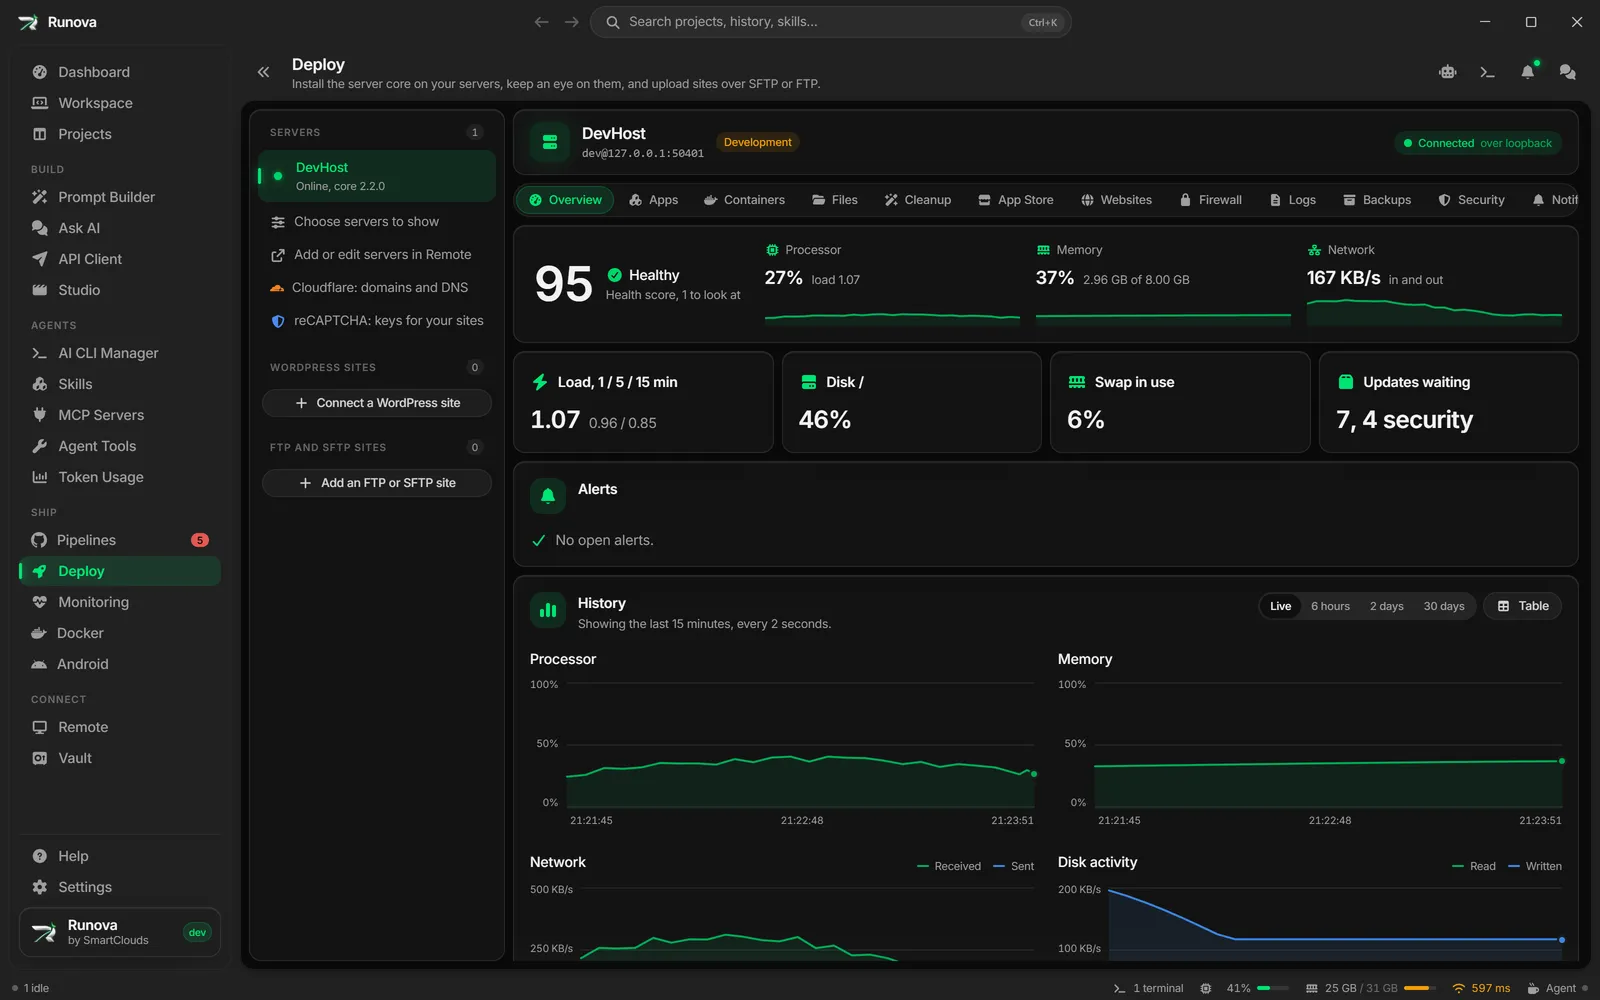
The Containers and Apps sections of a server in Deploy are where you work with Docker on that server. Containers shows everything the Docker engine runs, with live figures, logs and a console. Apps deploys compose files from your own projects as apps, with a step by step timeline, saved revisions and one click rollbacks.
Both sections need the server core to be installed and you to be signed in to it (see Servers and setup). What you can do depends on your role on that server: Viewer only looks, Operator runs and deploys things, Admin can also open consoles, see secret values and delete data. Buttons you are not allowed to use are hidden or disabled with a hint, and the server checks every call again.
Where to find it
Click Deploy in the sidebar, pick a server in the server rail on the left, then click Containers or Apps in the strip of sections above the content. The same strip also holds Overview, App Store, Websites, Firewall, Logs and Security. You can also open the command palette and type Deploy.
If this computer is not signed in, the section shows a card with a Sign in button instead. Click it and sign in right there; the containers appear once you are in. While the connection to the server is still being tried, the card says Reconnecting with a spinner and opens by itself when the server answers.
Containers
Docker is not installed or not running
If Docker is missing on the server, the Containers section shows a Docker is not installed on (server name) card instead of a list. It explains that the install uses Docker’s own repository on download.docker.com, checks the repository key against Docker’s published fingerprint, starts Docker and turns it on at boot.
- Click Install Docker (Admins only; other roles see “Ask an Admin of this server to install Docker”).
- If the server has packages that get in Docker’s way (podman, buildah and runc on the RHEL family are the usual ones), the card lists them and asks you to tick Remove (packages) before installing. Containers those packages run stop and are not moved over to Docker. The button stays disabled until you tick the box.
- A job window opens with the live install log. You can close it and the install keeps going, or click Cancel the job if you change your mind.
If Docker is installed but stopped, the card says Docker is installed but not running and offers Start Docker (Operators and above).
The container list
Once Docker runs, the top of the section shows a line with the Docker version, the Compose version (or “no Compose”), the cgroup version and the storage driver. Below it are five tabs: Containers, Images, Volumes, Networks and Disk use.
The Containers tab lists every container on the server, grouped by compose project. Containers that did not come from compose sit in a group called “Not in a compose project”. Each group header shows how many of its containers are running (for example “2 of 3 running, 1 stopped”) and the project’s folder on the server. Click a header to fold or unfold the group. The log button at the end of a compose project’s header opens that app’s logs and consoles (see Logs and consoles of an app).
Each row shows:
- A state chip in words and with an icon, never color alone: Created, Running, Paused, Restarting, Removing, Exited, Dead or Unknown. A running container that has a health check adds its health, such as “Running, unhealthy” or “Running, starting”.
- The container name, and below it the compose service and the image.
- Processor and memory with a small chart of the last few minutes (on wide windows).
- Its published ports, such as
127.0.0.1:8080 -> 80/tcp, or “No ports”. A globe icon in warning color marks a port published on every address, which means anyone who can reach the server can reach that port. - A three dot menu with the lifecycle actions, for Operators and above.
Type in Find a container by name, image, project or port to filter the list. The count next to the box shows how many containers there are. An empty server says “No containers on this server yet. Start one from the App Store or deploy a project.”
If the connection to the server core drops, the lists stay on screen but dim, and refresh once the connection is back. If live figures stop coming in, a warning line above the list says so.
Start, stop and other actions
Click the three dot menu on a row (or in the container panel header) to see the actions that make sense for the state:
| State | Actions offered |
|---|---|
| Running | Stop, Restart, Pause, Kill |
| Paused | Resume, Stop, Kill |
| Restarting | Stop, Kill |
| Anything else | Start |
Kill asks for confirmation first, because the container stops at once without a chance to finish or save anything. The menu also has Remove… (see below). A toast confirms each action, for example “Restarted web”.
The container panel
Click a container’s name to open its panel, which slides in from the right. The header shows the name, the state chip, the image, quick buttons (Restart and Stop for a running container, Resume for a paused one, Start otherwise), Send logs to the project CLI, Browse files (for Admins, see Server files) and the same three dot menu. It has seven tabs.
Overview
Facts about the container: image, status, compose project and service, restart policy and how many times it restarted, when it came up (or last started), the exit code (and “killed for running out of memory” when that happened), any engine error, current processor, memory and process count, its limits, command, entrypoint, user, working folder, networks with their IP addresses, and whether it runs privileged and with a terminal.
Stats
Four charts for a running container: Processor (100% is one core), Memory (against its limit), Network (received and sent per second) and Disk (read and written per second, plus the process count). A container that is not running says it has no live figures.
Logs
The last 500 lines of the container’s log, then new lines as they arrive while Follow is on. Each line has a time and a column that says out or err for stdout and stderr. Controls:
- Lines to read starts the log with the last 100, 500, 1,000, 2,000 or 5,000 lines.
- Search the log marks matches and shows “1 of 5”. Press
Enterfor the next match andShift+Enterfor the previous one, or use the arrow buttons. - Follow keeps the view at the bottom. If you scroll up to read, it stops jumping.
- Read again appears when the stream ended (for example because the container stopped).
- Send to the project CLI (see below).
Inspect
Environment variables are listed by name only, with values hidden as dots. Admins can click Show values (after confirming their password again) and later Hide values. Other roles see “Values are for Admins”. Revealed values stay on screen only while you have the panel open and are never saved. Labels lists the container’s labels with their values.
Mounts
A table of what is mounted into the container: the path inside, where it comes from (volume name or host path, with its type) and whether access is read and write or read only.
Ports
Each port with a plain explanation: “Only other containers on its network reach it”, “Only this address on the server”, or “Public: anyone who can reach the server reaches it”.
Console
A shell inside a running container, for Admins only (other roles see that consoles are for Admins). Click Open a console to start bash (or sh) as the container’s own user. Click Close the console to end it, or Open a new one after the shell exits.
To run one command instead, type it in Command, such as php artisan migrate or psql -U postgres, and click Run. It runs through sh, so pipes and && work, in a terminal you can type into (for prompts and interactive tools). User picks who runs it: Its own user (the image’s user), root, or any name or id you type, such as www-data or 1000:1000. After the command ends, Run it again runs it once more and Back returns to the form with your command kept.
Opening and closing a console are recorded in the server’s audit trail, with the command and the user. What you type into it is not. If the connection to the server changes while a shell is open, a new shell takes over and says so. A command is never run a second time by itself: its console ends with “The connection to the server changed, so the command was not run again.”
Send a container’s log to a project CLI
Send logs to the project CLI (in the panel header and on the Logs tab) builds a prompt from the end of the container’s log (200 lines) and a description of the container, with secrets taken out, for the coding CLI of one of your projects. No environment value is ever put in the prompt.
- The app picks the project whose name matches the container’s compose project. If none matches, a dialog asks Which project runs (container)? Pick one and click Use this project. The app remembers the choice on this computer.
- Check the prompt in the dialog that opens, then run it in the project’s CLI.
Remove a container
Choose Remove… from the menu. The dialog says what will go: a running container is stopped first, then the container and anything written inside it are gone, while its image stays. Click Remove the container.
Admins also see Also remove its volumes, which deletes the anonymous volumes the container created (named volumes, such as a database’s, stay). When you tick it you must type the container’s name, and the button changes to Remove with its volumes. Data in removed volumes cannot be brought back.
Images
The Images tab lists the images on the server with tags, size, age and how many containers use each one.
- Operators and above can type a reference in Image to pull (for example
nginx:1.29orghcr.io/org/app:1.0) and click Pull. A job window shows the layers downloading. If you saved a sign-in for that registry on this computer it is used, so private images work (see Registries). - The trash button removes an image after a confirmation. If containers use it, the dialog warns that they keep running but cannot be created again without pulling the image, and the button reads Remove anyway.
Volumes
The Volumes tab lists each volume with its compose project, size and how many containers use it. Admins can open a volume’s files with the folder button on its row (see Server files), and can remove a volume that no container uses. You must type the volume’s name to confirm, and the dialog warns that everything stored in it is deleted.
Networks
The Networks tab lists each network with its driver, whether it is internal only, its subnets and how many containers are on it. Built in networks are marked Built in and cannot be removed. Operators can remove a custom network that has no containers on it.
Disk use
The Disk use tab says how much space Docker uses on the server and how much could be freed. Cards for Images, Containers, Volumes and Build cache show the size, how many exist, how many are in use and how much is reclaimable. Admins get buttons to remove unused things per card (images no container uses, stopped containers, volumes no container uses, the build cache) and Clean up everything unused, which also clears the build cache and unused networks. Pick what to remove opens the server’s Cleanup section, where you choose item by item. Removing volumes this way asks you to type the server’s name. A toast reports how many items went and how much space was freed.
Warning: Pruning volumes deletes data for good. Check Disk use first and make sure nothing you care about sits in an unused volume.
Cleanup
The Cleanup section of a server lists what Docker keeps there that nothing uses: images no container runs (an untagged one is marked Untagged), stopped containers, volumes no container mounts and networks no container is on. Each item shows its age and, where Docker reports one, its size. The card at the top says how much Docker uses and how much could be freed, split by kind.
- Narrow the list by kind, by age (Over a week, Over a month, Over 3 months) or by typing part of a name or project. An item Docker gives no date for only shows under Any age.
- Tick single items, or a whole group with the box in its header. The bar at the bottom says how many are picked and about how much space they free.
- Remove selected asks first. When volumes are in the selection it also asks you to type the server’s name, since their data cannot be brought back.
- Stopped containers go first, so an image they held can go right after. If Docker refuses one item, the rest still go, and the refused one stays ticked with Docker’s reason under it.
- Clear build cache removes every cached build step. The next build on the server starts from scratch. A server whose core is too old for this says so and offers the core update.
Operators can remove images, containers and networks. Removing volumes and clearing the build cache are for Admins. Viewers see the list only.
Apps
The Apps section deploys Docker Compose apps from the projects on your computer onto the server. The app’s ports stay on the server itself, and public access comes through Websites. Every deploy is saved as a revision you can roll back to. (Apps installed from the App Store also appear here, since they are compose apps too.)
The apps list
The list shows one card per app with its name, a status word, the project and compose file it came from, which revision is live and how many containers run. Statuses are: Not deployed, Working, Running, Degraded, Stopped, Taken down and Failed.
Two buttons sit at the top: Registries (sign-ins for private images, see Registries) and New app. New app needs the Operator role. With no apps yet you see “No apps on this server yet” and a New app button.
Deploy a new app
The New app wizard has five steps: Source, Configure, Expose, Review and Deploy. You can click back to an earlier step you already reached.
- Source. Pick a Project (the projects added in Runova, see Projects). Then pick one of its Compose file entries (it lists each file with its service count; the app finds files like
compose.yamlanddocker-compose.yml). Choose an Environment or leave No environment. The environment’s files become the app’s.envon the server, and the values stay out of the window. Finally set the App name: the compose project name on the server, using lowercase letters, digits, dashes and underscores. A name already used by another app on this server is refused. Click Next. - Configure. Shows the Services the compose file runs (a service that builds from the project says so), the Environment key names that go up (names only), and a warning if the compose file uses variables the environment does not set (compose reads those as empty). If the file cannot be deployed as it is, a red box says why and Next stays disabled.
- Expose. Shows who can reach each published port. Ports are kept private by default: the server binds them to
127.0.0.1so only the server itself reaches them. Use the Keep private switch per service to change that. A table shows each port as written in the compose file and what it will be after the deploy. A service that uses host networking cannot be kept private. The override file the server writes shows the exact file. Published ports skip the server’s firewall, so keep a port public only when nothing else will do. - Review. Lists the findings of a safety check on the compose file, worst first (Critical, High, Medium, Low). Anything above Low gets a checkbox you must tick to deploy, and each one you accept is recorded in the server’s audit trail. Low findings are listed as advice under “Worth fixing, nothing to accept”. The checks look for things such as privileged containers, host networking, mounts of the Docker socket, dangerous capabilities, public port bindings and images tagged
latest. A Registry sign-in card shows which sign-in each image’s registry will use. Click Deploy (app name) (Operators only). - Deploy. The app uploads the compose file and
.env(and the project folder when a service builds from it, without what.dockerignoreleaves out) with a progress bar. The server then checks the files as Docker Compose reads them. If it turns the file down, the revision is kept as Invalid with the reason, and you go back, fix the file in the project and deploy again. If the server finds more to accept, you tick those and click Accept and deploy. Then the deploy timeline runs. When it ends, click Open the app.
Deploy timeline
A deploy shows as five steps with a state, a duration that ticks while it runs, and the log lines it wrote: Validate, Pull images, Build, Start containers and Health check. The running or failed step opens by itself, and you can click any reached step to open or close its log. A failed step shows its reason, and a cancelled deploy says that what ran before keeps running. While a deploy runs, Operators can click Cancel the deploy.
Open an app
Click an app card to see its page. The header shows the name, status, which revision is live and how many containers run, then where it came from (“From (project), (compose file), with the (environment) environment”). A toolbar has:
- Deploy again, which opens the wizard with the source filled in and deploys a new revision. It needs the project to exist on this computer.
- Start, Stop, Restart and Take down. Take down removes the containers and networks but keeps volumes and revisions, so a deploy brings the app back.
- Delete, which removes the containers and revisions but keeps the volumes.
- Delete with its data (Admins only), which also deletes the volumes. You must type the app’s name to confirm.
- Add health check, which opens Monitoring with a new target filled in from the app (its name, project, server and address). Once the app has one, the button becomes Health check with the target’s state and opens it. See Monitoring.
- Logs and Console (Admins only), which open the app’s logs and consoles (see below).
The lifecycle buttons need the Operator role and are disabled while a job works on the app. Start, stop, restart, take down and delete open a job log window.
Below the toolbar:
- The timeline of the shown revision.
- Services: each service with its image, ports and containers (with state and health). Each container has a log button, and a running one a console button.
- Revisions: every upload is kept, with its number, state (Waiting for files, Ready, Invalid, Deploying, Live, Failed or Replaced), date and who made it. Click one to see its timeline. Roll back (or Roll back to this revision in the timeline) deploys an older revision’s files again as a new revision, after a confirmation. Only revisions that ran once can be rolled back to.
- Route map: where each published port leads, starting with the domains whose sites in Websites forward to it (or No domain). Add domain (Admins only) puts a port on the internet through nginx. Enter the domain, choose whether to get an HTTPS certificate from Let’s Encrypt and whether to let WebSocket connections through, then Add the domain. It adds the site in Websites, applies nginx and asks for the certificate, showing each step as it runs. If a step fails, it says why, and Try again keeps what you typed. Point the domain’s DNS at the server first. The button is off for UDP ports, for ports bound to another address than this server or every address, and until nginx is set up under Websites.
- Registry sign-in: see Registries. It has a switch to send this computer’s sign-ins with this app’s deploys.
- Files of revision N: click to see the compose file as uploaded, the env key names and the loopback override file. Env values stay on the server.
Logs and consoles of an app
A panel on the right with two tabs, opened from an app’s page, an installed app in the App Store, or a compose project’s header in the container list.
- Logs follows every service of the app together, each line with its service name in its own color, the way
docker compose logs -fdoes. Pick one container in the log list to read it alone. The core follows at most four container logs at once, so an app with more services shows the first four together and says so. The level filter, time range, search, Lines to read, Follow, Download and Ask the AI work as in the Logs section’s viewer (see Assistant and logs). - Console (Admins only) opens a shell or runs a command in one of the app’s running containers. Pick the container first when the app has more than one running. It works like the Console tab of the container panel. When nothing runs, it says to start the app first.
Tips
- Use Keep private for every service and put a domain in front of it in Websites, so traffic goes through nginx and the firewall.
- Check the Registry sign-in card on the Review step when an image is private, so the pull does not fail.
- Roll back from the Revisions list if a new deploy does not come up healthy. Data in the app’s volumes stays as it is.
- Problems after a deploy? Look at the Logs section and its problems feed, see Assistant and logs.